On Reproduction Number R0 and Singapore's real time effective COVID-19 Reproduction Number Rt
25 Dec 2020TLDR
This blogpost argues that the effective reproduction number \(R_t\), as compared to daily reported new cases, is a more representative measure of the current SARS-CoV2 (also known as COVID-19) infectious spread in Singapore. The analysis described herewith showed the importance of subcategorisation when calculating the latest \(R_t\) values for Singapore’s overall, community and dormitory SARS-CoV2 infections. Significant results arising from the subcategory analysis performed on data extracted from 1st January 2020 to 20th December 2020: Overall, community and dormitory \(R_t\) were 1.4, 0.5 and 0.91 respectively. Finally, it was forecasted that SARS-CoV2 would continue to persist within our communities and is unlikely to be completely eradicated in the near future.
 Picture of Peninsula Plaza in Phase 2 of circuit breaker on 20th December 2020
Introduction
Within a few weeks, we will be reaching the 1 year mark of the SARS-CoV2 pandemic outbreak in Singapore. Our first case was detected on the 23rd January 2020.
As I am writing this post, we are going into phase 3 of our cicuit breaker measures, on the 28th of December 2020. I thought it would be meaningful, at this critical juncture, to use publicly available data to evaluate the current SARS-CoV2 pandemic situation in Singapore. Particularly from the public health standpoint, regular objective assessments of an infectious disease outbreak is often necessary to determine public policy measures (e.g. social distancing, number of visitors allowed to a home, number of diners allowed to sit together at a dining table, etc.).
Robust metrics of transmission based on well established models are often used to make these assessments. The most common, basic and well understood metric is the number of new cases of an infectious disease reported daily. In Singapore, this metric is reported over social media, mainstream media and government official websites regularly. Other metrics not commonly discussed on these media platforms are:
- Reproduction Number (\(R_0\))
- Attack rate
- Infection rate
- Serial Interval
- Transmission risk and rate
For this particular blog post, I would like to discuss \(R_0\). This metric received significant attention and discussion, after a popular Facebook post by Singapore Prime Minister’s wife Mdm Ho Ching as linked here. I present a quote from her Facebook post:
In addition, we have Covid safe precautions in place among our people, like safe distancing, mask wearing, hand sanitising or cleaning, and crowd management. This is critical in driving down average secondary transmission from an \(R_0\) of 2-3, down to an \(R_0\) of about 1. This means instead of infecting on average 2-3 other persons, an infectious C+ index case in Singapore infects about 1 other person.
Ho Ching
What is the reproduction number, \(R_0\)?
\(R_0\) can be defined as the number of secondary infections produced from an actively infective person, assuming everyone is vulnerable to the infection. There are numerous great videos on YouTube explaining this concept here and here. Wikipedia also has a great explanation of \(R_0\) here. The utility of \(R_0\) lies in its interpretation:
- \(R_0 < 1\) suggests declining infectious spread.
- \(R_0 = 1\) suggests a sustained and stable infectious spread.
- \(R_0 > 1\) suggests an uncontrolled and growing infectious outbreak.
\(R_0\) can be calculated in many ways. The basic formula looks deceivingly simple: Average number of infection producing contacts per unit time (\(\beta\)) multiplied by the mean infectious time period (\(\tau\)) as shown in equation (1) below.
\[R_0 = \beta\tau - (1)\]However, there are many difficulties involved in deriving both of these variables necessary for the calculations:
- In the early days of any pandemic, there will be limted data to help us accurately derive both of these variables. This can lead to inappropriate public health measures, espeacially when we underestimate the severity of an outbreak.
- These variables are also affected by public health measures such as movement control, quarantines, lockdowns, social distancing, mandatory orders to wear masks, etc. As more measures are instituted, we can further limit the mean infectious time period of infected individuals thus effectively limiting the spread.
- As interventions/treatments such as vaccines and antivirals appear, the number of infection producing contacts per unit time can be reduced.
- Lastly, the task of producing data to update these numbers are unusually onerous and difficult to undertake. For instance, to calculate just the number of infection producing contacts require (1) Aggressive contact tracing (2) Detailed history taking and physical examination of contacts. Most of the time, this is reduced to questionnaires. (3) Clinical investigation of close contacts. In the context of SARS-CoV2, a nasapharyngeal PCR and blood serological testing would be minimally indicated.
Estimations of Singapore’s \(R_0\) value
Data
I extracted data on the daily number of new SARS-CoV2 infections between 1st of January 2020 to 20th of December from Singapore’s Ministry of Health website, specifically from it’s situation report webpage. The report is presented on a sleek graphical interface powered by Plotly. For this study, I extracted the daily number of new cases reported under 3 subcategories: overall, community and dormitory infections. The CSV of the data can be found here.
Methodology
As we are not able to assume all individuals are vulnerable to disease, we cannot directly estimate \(R_0\). Instead, we estimated the effective reproduction number, \(R_t\), with the modelling technique from Abbott et al.’s R package EpiNow2. This was built upon the modelling techniques found in Anne Cori et al.’s R package EpiEstim. There are several factors considered as part of this modelling approach, such as the generation time, incubation period and reporting delay. If we refer to the simplistic illustration of calculating \(R_0\) in (1), the generation time and incubation period are analogous (but not directly equivalent) to the beta and tau variables respectively. To ensure realistic estimates of \(R_t\), we have to factor in the uncertainty between the time point of infection and the time point of reporting a new case. A generative Bayesian model is established.
Subsequently, Markov Chain Monte Carlo methods are used to estimate the posterior distribution and derive the \(R_0\) value. I have to admit that there is a lot of handwaving in my description of the algorithm. To keep this post short, I will leave a more detailed description on the approach for a seperate blog post. For reproducibility of my results, the corresponding R code with the parameters used for the modelling and the analysis can be found in my repository here.
Results
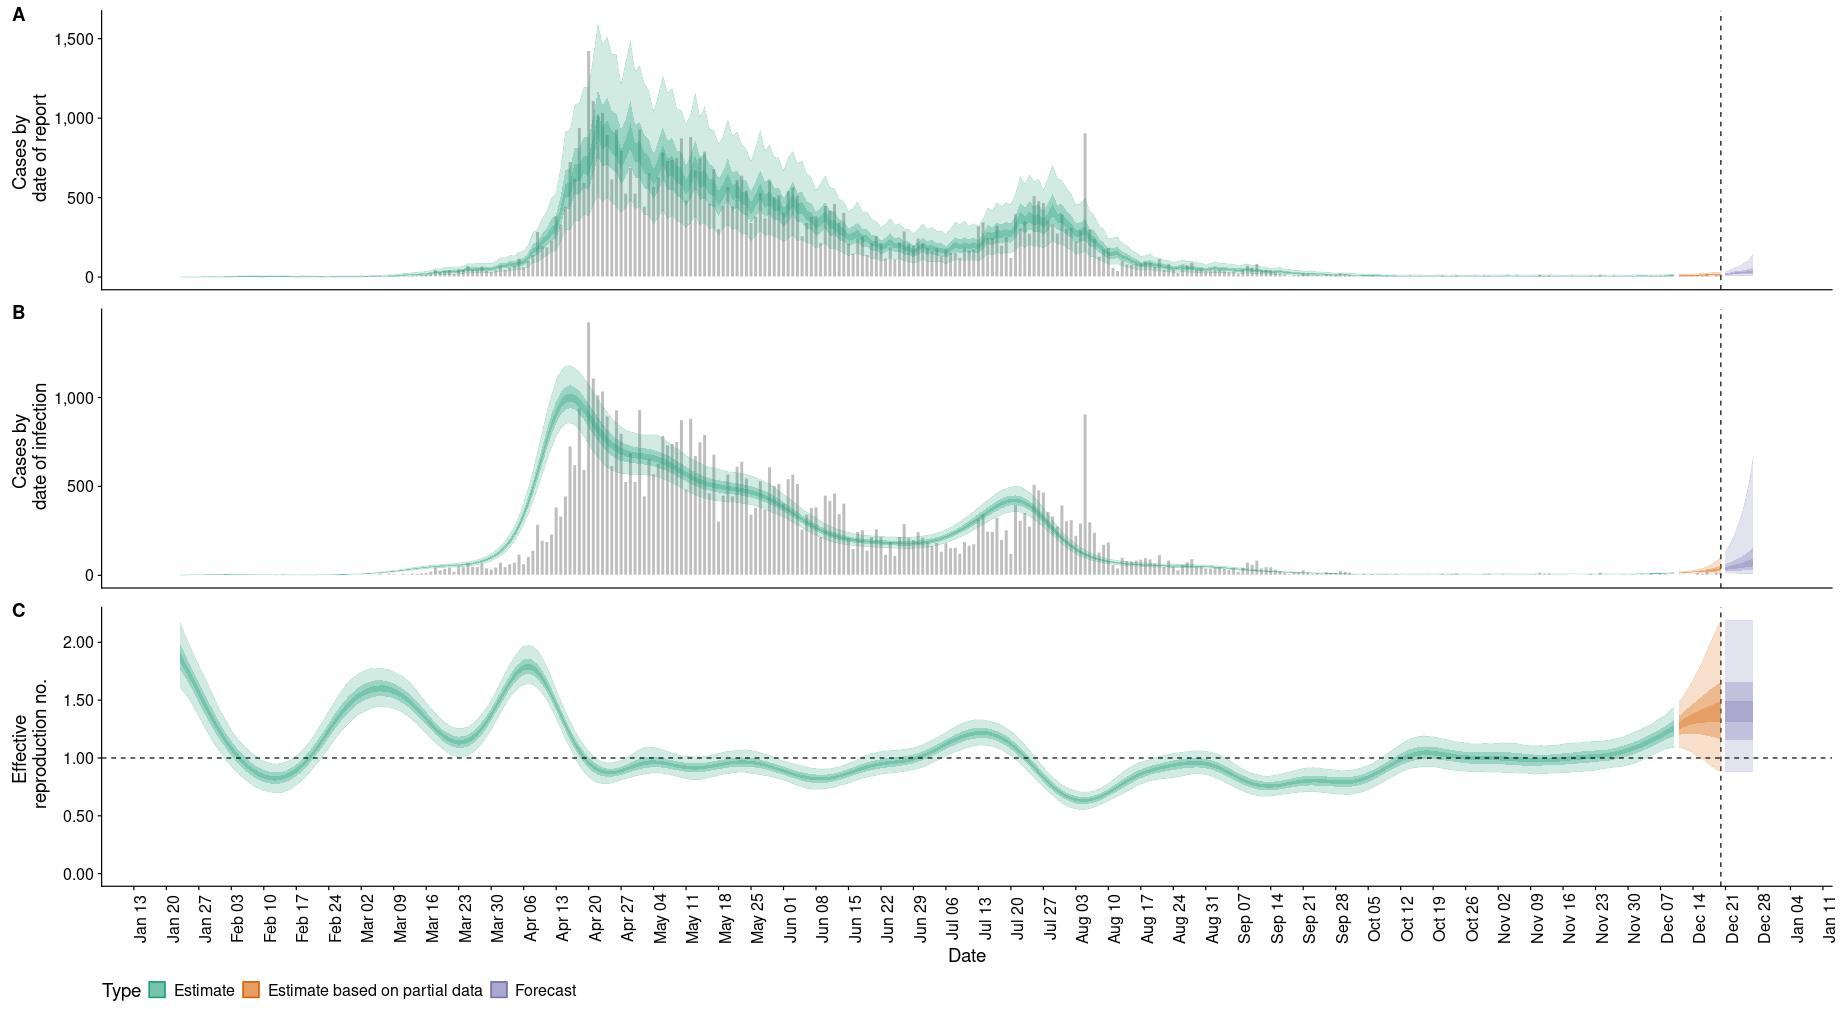
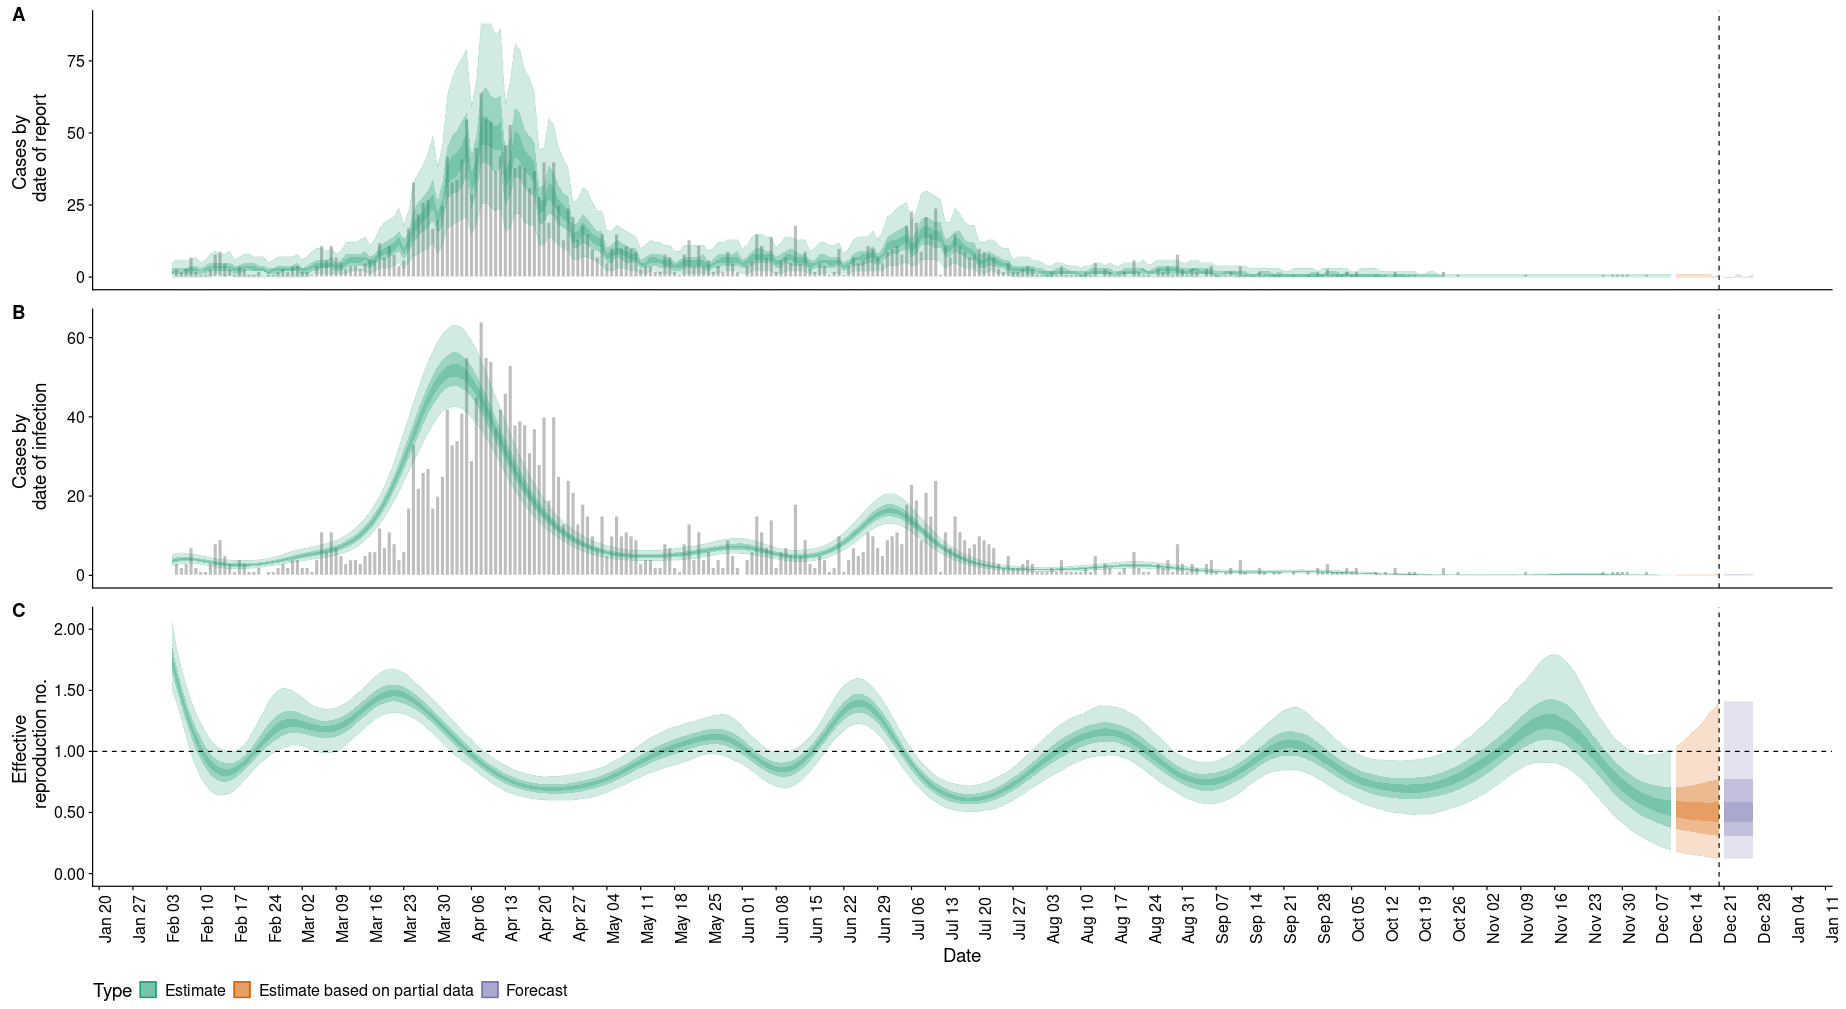
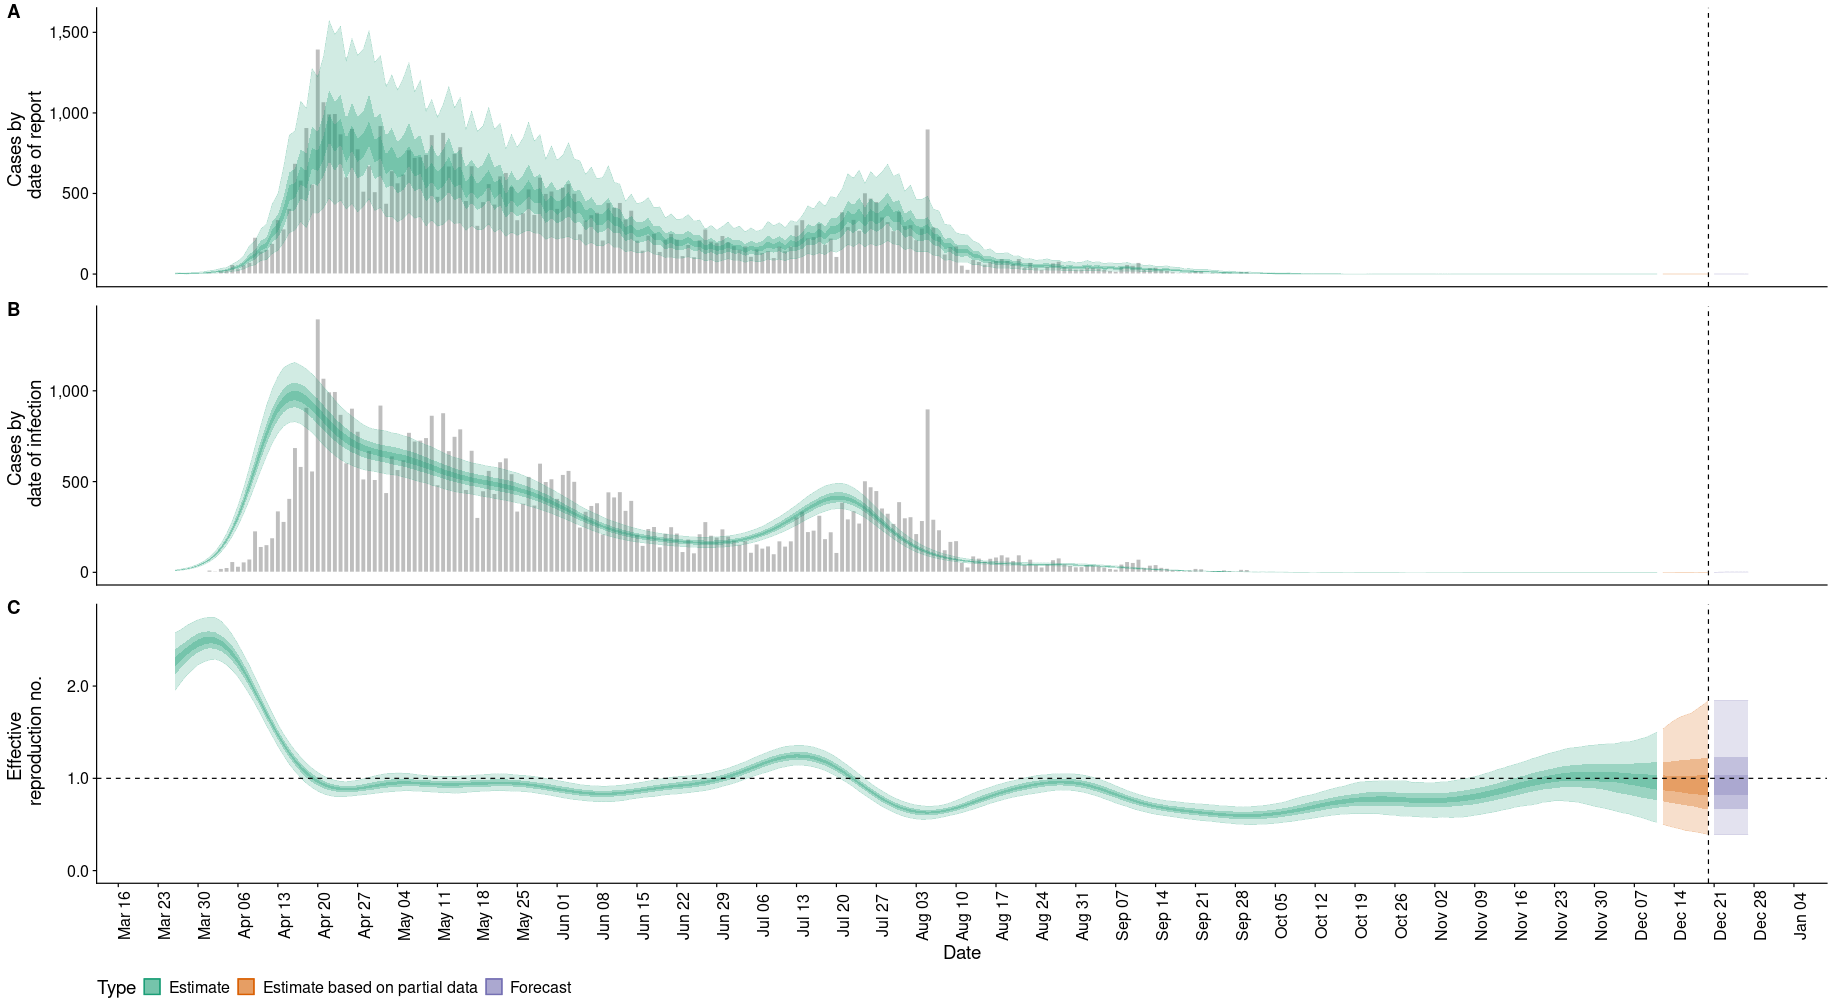
The analysis was performed on a daily basis between 1st January 2020 to 20th December 2020 for the 3 subcategories of data I extracted: overall, community and dormitory. The model produces 3 estimates: (A) Cases by date of report. (B) Cases by date of infection. (C) \(R_t\) by date.
Figure 1 here shows the results for overall infections:

Figure 2 here shows the results for community infections:

Figure 3 here shows the results for dormitory infections:

The most updated effective reproduction number, rate of growth and doubling/halving time as of 20th December 2020 were estimated. The results can be found in Table 1 as follows:
| ~ | Overall | Community | Dormitory |
| Effective reproduction number, \(R_0\) | 1.4 | 0.5 | 0.91 |
| Rate of growth | 0.11 | -0.15 | -0.024 |
| Doubling/halving days | 6.5 | -4.6 | -29 |
Discussion
Firstly, it is clear now that the number of infections reported daily is not as representative of the infectious spread as \(R_t\). We present 2 examples to make this point.
In example (1), we extract the numbers on 20th April 2020. On this day, Singapore had the highest number of reported SARS-CoV2 infections in a single day: 1426 cases. However, retrospective calculation of \(R_t\) on the same date showed the value to be a little less than 1. This is not surprising because:
- Cases are typically reported with a delay
- Measures have already been instituted many days or weeks prior to the peak number of infections. 20th April 2020 was day 14 of Singapore’s circuit breaker phase 1.
- It is mathematically impossible and illogical for \(R_t\) to be more than 1 on the day when there was a supposed peak in reported new daily cases.
Therefore, one might look at 20th April 2020 as the worst day in Singapore’s SARS-CoV2 outbreak. However, that is categorically false. Base \(R_t\) trend presented in Figure 1C, we now know that the worst day of Singapore’s outbreak actually happen sometime in the last week of March to the first week of April, where we saw the \(R_t\) value peaked to 1.8.
In example (2), we look at the numbers on 20th of December 2020. On this day, the number of new community infections is 0. One might have expected \(R_t\) to be 0. Insetead, the effective reproduction number is 0.5. Clearly, 0.5 presents a more truthful picture of unknown asymptomatic clusters in the community. This is also supported by sporadic reports of new community SARS-CoV2 infections.
In both examples (1) & (2), it is clear that \(R_t\) has greater utility in helping us to make a better assessment of Singapore’s SARS-CoV2 situtation.
Secondly, I put forth to you that the estimated \(R_t\) for Singapore reported in this post is fairly consistent with current literature. For instance, Figure 1C shows \(R_t\) of 0.74 on 14th Feburary 2020, which conincided with a reproduction number of 0.7 reported by Amna Tariq, et al. on the same date.
Thirdly, the overall \(R_t\) is 1.4 and the overall time required to double the number of new infections is 6.5. Can this be interpreted that Singapore is currently having an expanding SARS-CoV2 infectious outbreak? Short answer is no, because the resulted numbers from the analysis are inflated due to inclusion of imported cases in our overall total cases. This also explains why Singapore’s Ministry of Health routinely divides new cases into the subcategories of community, dormitory and imported.
Forthly, we note that the commmunity and dormitory \(R_t\) values are 0.5 and 0.91 respectively. Both numbers are less than 1. Not surprisingly, the rate of growth and the number of days required to half the number of infections are represented as negative numbers. This suggests that the current SARS-CoV2 infectious spread is under control and are declining within our communities and dormitories. Of note, the community and dormitory \(R_t\) trends shown in Figures 2(C) and 3(C) respectively are volatile. The 95% confidence interval often captures 1. This corroborates with current evidence that asymptomatic spread of the disease continues to exist within our community and dormitories. Like what the experts said here, the disease is unlikely to be completely eradicated. Hence, we should be constantly cautious and be prudent with our actions in the upcoming months ahead.
Future work
Weekly updates on new estimates of Singapore’s effective reproduction number
As the \(R_t\) is not routinely reported in Singapore Ministry of Health’s daily report, I will calculate it on a weekly basis (every Monday) and post the latest results on my blog.
The official EpiNow website also produces Singapore’s \(R_t\) here. The differences between my calculations and the official website calculations will be:
- I will calculate \(R_t\) based on the various subcategories: overall, community and dormitory.
- I will include a longer duration of data starting from January 2020.
- The source of my data will be directly from the PDF archive reports found on Singapore’s Ministry of Health website here.
Improved visualisation of estimates
The current figures and tables are difficult to visualise. There is an accompanying visualisation tool to the models used in this post: RtD3. I will probably put it up as a static page on this blog to make it easily accessible.
Disclaimer
Work done and opinions expressed within this blog post are done in the capacity of a private citizen. They are not representative of the institutions I worked for and should not be understood as medical advice. Many thanks for reading.